
I Built a Neural Network for Golf Shots. It Found the Sweet Spot.
Henry Anderson • June 2026 • 14 minute read
"Neural network" might be the most repeated phrase in modern technology, yet very few people using it could explain what one actually is. I didn't like being one of them. So I decided to learn the best way I could think of: I built one around a question I actually cared about: Could six numbers describing a golf club at impact predict how far the ball would fly?
This post follows that project from start to finish: collecting nearly 2,000 shots, building a simple linear model as a baseline, training a neural network to beat it, and discovering it had independently learned something every golfer already feels in their hands. Along the way, you'll learn what a neural network actually is—and you'll even get to play with one yourself with the interactive simulator at the end.
“Before we start... Everything here is real: real Trackman data shared publicly by its collector, models I trained on my laptop, and a clubface simulator that runs one of them live in this page. It is also small: my golf network has 401 adjustable numbers, and ChatGPT-class models have around a trillion, plus years of engineering this post doesn’t touch. Same core idea, very different scale. And these are other golfers’ swings, not mine; more on that at the end.”
This project in three charts
If you're short on time, these three charts tell the whole story. Everything else in this article explains how we got there.
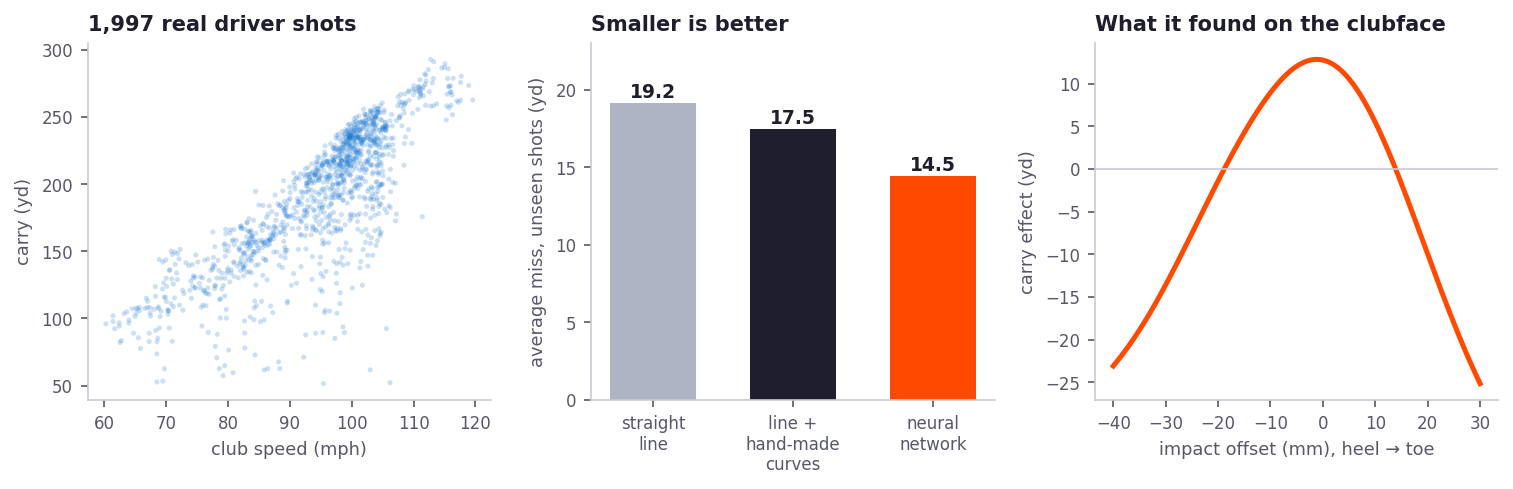
Left: Nearly 2,000 real driver shots measured by a TrackMan launch monitor. Faster swings generally go farther, but shots at the same speed still vary by more than 60 yards.
Middle: The neural network predicts unseen shots more accurately than either linear baseline.
Right: The network independently learned the cost of missing the center of the clubface—a relationship a straight-line model can't capture.
Why golf makes a great machine-learning problem
Every golfer knows a heel strike goes nowhere. Your hands know it before your brain finishes the swing. I wanted to find out whether a pile of arithmetic, given only measurements and no golf knowledge whatsoever, would figure that out on its own, and how much better it would get at predicting ball flight in the process. That's a fair, checkable test of what these models actually do, when playing I have a natural feel for this. If a small network can earn my trust on golf, I'll approach the big ones with sharper questions.
The data
The shots come from a Trackman launch monitor: 10,169 real driver swings, shared publicly on GitHub by their collector. Each row is one shot, measured twice over: what the club was doing at impact (club speed, attack angle, club path, face angle) and what the ball did afterward (ball speed, launch, spin, apex, carry). On 2,331 of the shots, the radar also inferred the strike location: the spot on the clubface where the ball met it, in millimeters from center, horizontally and vertically. Anyone who has used a Trackman is very familiar with this data. After dropping rows with missing readings, shots hit with limited-flight range balls, and a small tail of sensor misreads, 1,997 premium-ball shots with strike location remain. Those are the shots everything below is built on.
The rules I set: the model's inputs are strictly delivery-side, meaning club speed, attack angle, club path, face angle, and the two strike coordinates. Ball speed, launch angle, and spin are not used, because those are results of impact, and predicting the flight from the flight is cheating. The output is carry: how far the ball flies before it lands. And every accuracy number in this post is measured on shots the model never saw during training, because grading a model on its own training data is the other classic way to cheat.
Start with a straight line (that's one neuron)
Before the network, the baseline it has to beat. The simplest honest model is linear: take each input, multiply it by some weight, add everything up plus a constant, and call the total your prediction. Fit those weights to data and you get a machine that looks like this:
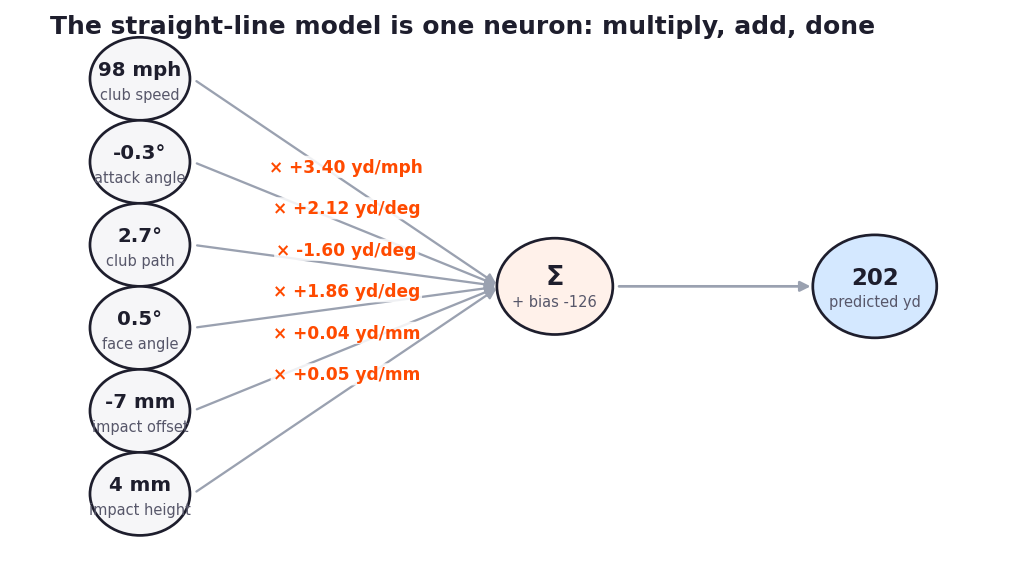
The fitted straight-line model, drawn as what it is: a single neuron evaluating the dataset's typical shot. Each input is multiplied by a learned weight (orange), summed with a learned bias, and the total is the predicted carry. The weights are already little discoveries: about +3.6 yards per mph of club speed, and almost nothing per millimeter of strike location, because no single straight-line slope can describe what strike location actually does.
That diagram is a real neuron, the actual unit neural networks are made of. Multiply, add, done. And it works, up to a point: graded on unseen shots, the line misses by 19.2 yards on average. Club speed alone explains a lot of golf (the correlation with carry is 0.83), and the line milks it. A straight line gets you surprisingly far, which is worth remembering every time someone reaches for a neural network before trying anything simpler.
But look at the line's weight on impact offset in the figure: +0.04 yards per millimeter. The model is claiming that moving your strike from the heel toward the toe helps, always, by a fixed amount per millimeter, forever. Every golfer knows that's wrong. Center is best; both directions away from center are worse. The line isn't stupid, it's structurally incapable: one slope per input is its entire vocabulary, and "the middle is best" is not a slope.
“The one idea to hold onto... A neural network is a pile of straight-line rules, stacked so the pile can bend.”
How stacking bends the line
Here's the whole trick. Instead of one neuron, use a first layer of many neurons, each computing its own weighted sum of the inputs, each drawing its own straight line through the data. Then feed their outputs into another layer of neurons, which treat those outputs as new evidence. Each neuron alone is as limited as the baseline. Stacked, they can approximate almost any shape, including "great in the middle, bad at both ends."
The bending is easiest to see in two dimensions, so here is a picture from a simpler world: a toy dataset where blue points live inside a ring of red, and a network with four hidden neurons learns to separate them.
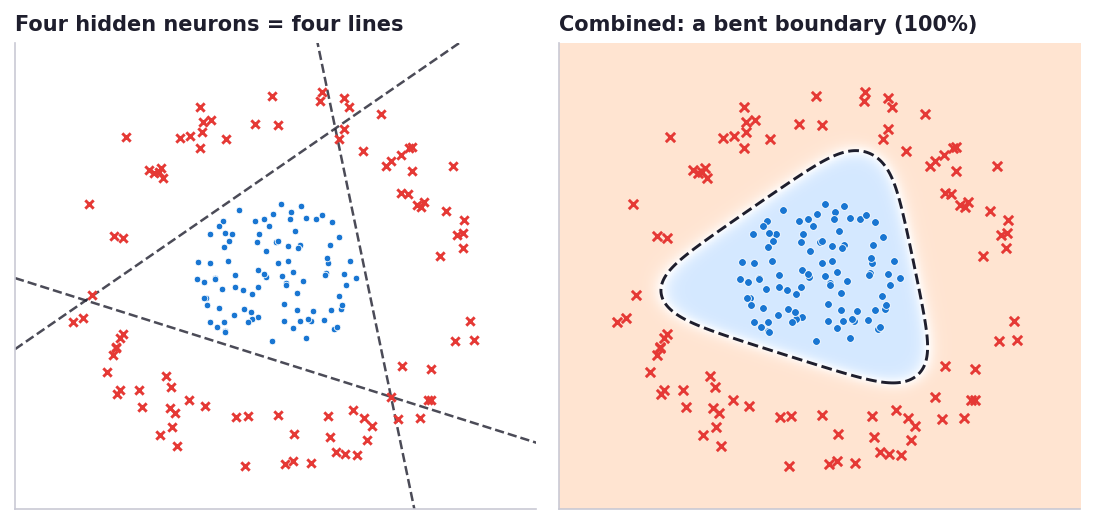
A two-input toy problem, shown because you can watch the mechanism with your own eyes. Left: the four dashed lines are the four hidden neurons; each one only knows how to split the plane in two. Right: the second layer re-weighs those four straight opinions into a single bent boundary that catches the ring. Nothing about circles was programmed in. My golf network does the same thing in six dimensions, where I can't draw it for you: the sweet spot is this ring, one dimension at a time.
One important observation: between layers, each neuron's output gets passed through a gentle S-shaped squashing curve. That step looks cosmetic and is actually the entire point. Stack layers without it and the algebra collapses: a chain of straight-line rules combines into one straight-line rule, no matter how many you stack. The little bend between layers is where all the bending power comes from. This was the single biggest thing I misunderstood before building one; I assumed the magic was in the wiring, and it's actually in the bend.
Training is a ball rolling downhill
Nobody sets those 401 numbers by hand. Training sets them, and the idea is amazingly simple. Define a loss: one number measuring how wrong the model currently is across all the shots. Imagine a landscape where every possible setting of the knobs is a location and the loss is the altitude there. Somewhere in that landscape is a valley where the network predicts golf as well as it possibly can. Now: drop a ball, let it roll. At every step, the network senses which direction is downhill and nudges every knob slightly that way. The step size is called the learning rate, and choosing it is a real art:
My golf network is about as small as they come: the six inputs, one hidden layer of 16 neurons, another of 16, and one output neuron predicting yards. In total, 401 adjustable numbers, against the straight line's seven.
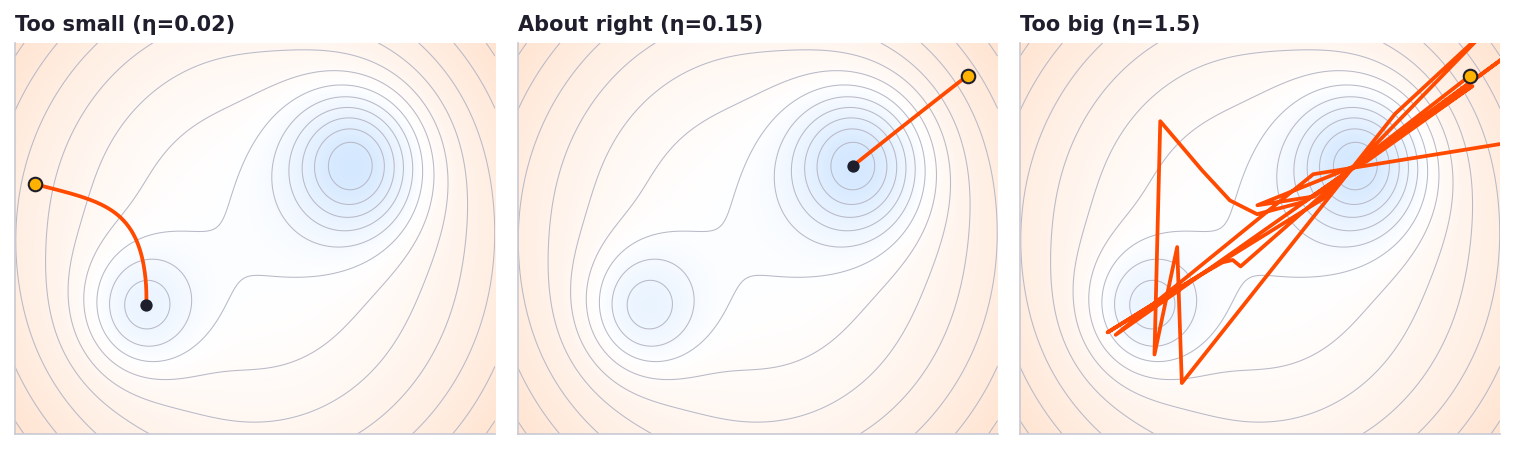
Three balls on the same loss landscape (darker blue is lower). Too small a step (η = 0.02) and the ball crawls into the nearest dip and stays there, a local minimum. About right (η = 0.15) and it strides into the deep valley. Too big (η = 1.5) and every step overshoots the slope it measured; the ball ricochets off the landscape entirely, which practitioners experience as their loss becoming an error message.
This picture is two-dimensional so I can draw it; my golf network rolls downhill in a 401-dimensional space. Here is the actual descent, logged while it trained:
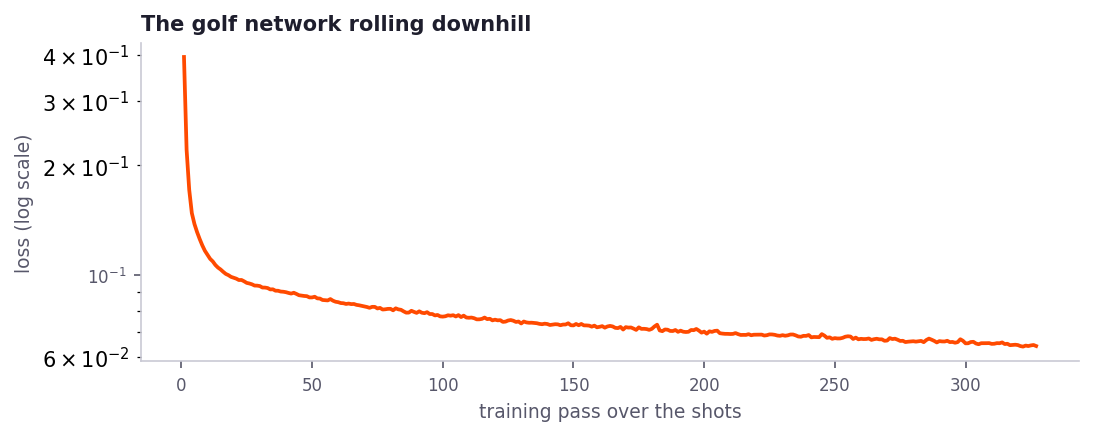
My golf network's real training run: wrongness after each pass over the shots, falling three-hundred-fold. The fast early drop is the ball finding the valley; the long tail is it settling toward the floor.
How the network senses "downhill" across hundreds of knobs at once is a piece of math called backpropagation. The short version: an efficient bookkeeping trick prices every knob's share of the blame for each miss, at about the cost of running the network once.
The results
Three models, same shots, same grading on unseen data. The straight line misses by 19.2 yards on average. A straight line upgraded by hand with squared strike-location terms (the one curve a physics-aware human would think to add) misses by 17.5. The network misses by 14.5.
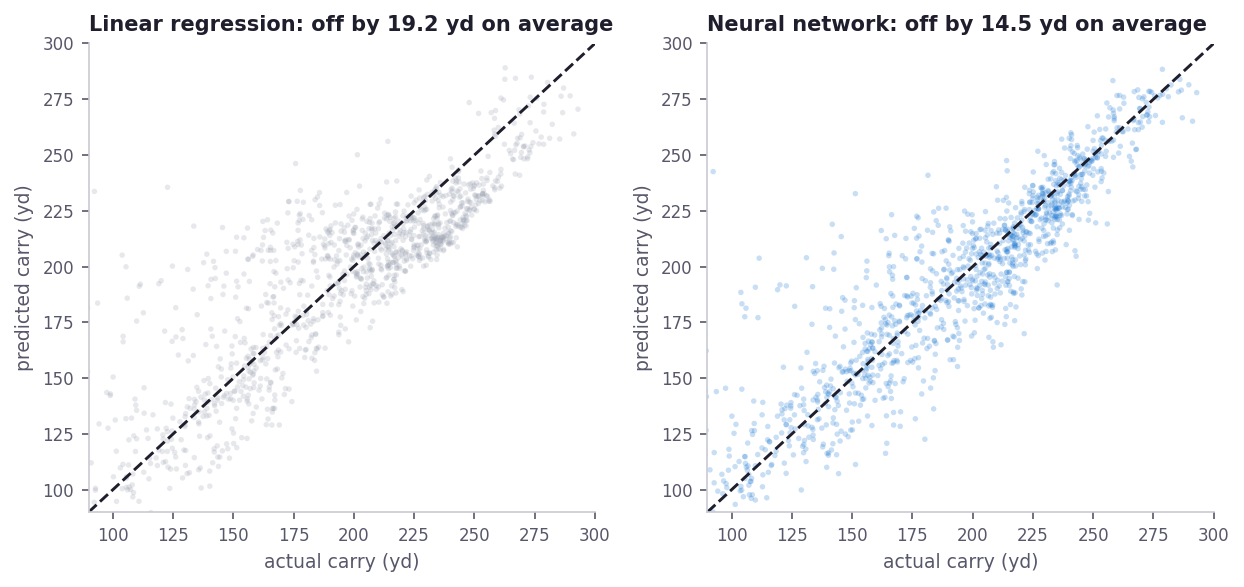
The straight line and the network predicting unseen shots, guess against truth. A perfect model would sit on the dashed line. The network's cloud hugs it visibly tighter at every distance.
The gap deserves an honest breakdown. Deny the network the strike-location columns and it still reaches 15.5 yards, so most of its edge comes from bending the everyday relationships: carry per extra mph is not constant, and the delivery angles interact. Strike location buys only the final yard, the smallest slice of the improvement. It is also the slice I can check against something I know in my hands, which is why it gets its own section. One more stress test: shots from the same session sit close together in this file, so I also graded on whole held-out sessions rather than shuffled single shots. Both models get worse, 20.3 against 17.2 yards, and the network still wins.
The sweet spot it found
Here is the part I actually built all this for: what exactly does the network believe about strike location? To ask it, I pinned everything else about the swing to one stock delivery, hitting +2° up with a square face and square path, set the club speed to 100 mph, and swept the strike point across the whole face. The answer is a picture:
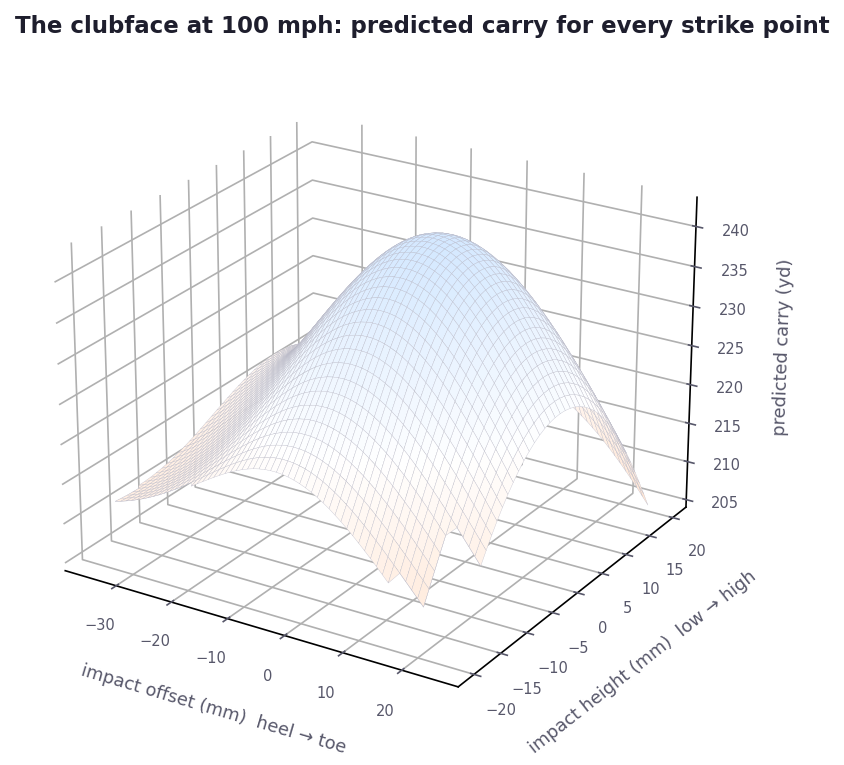
The trained network's predicted carry for every strike point on the face, at the stock 100 mph delivery. A dome peaking at 243 yards within a few millimeters of face center, giving up roughly 27 yards by the far heel, about 18 by the toe edge, and the most of all (38) up in the high-toe corner. Trust the shape more than the altitude: against the closest matching real shots, the model's absolute yardages run optimistic in the middle of the speed range. The holes are honesty: face regions with almost no real shots, where the model has no business drawing confident numbers. Averaged over eight training runs.
Play the sim
Better than looking at charts, try your own swing. This interactive neural network was trained on nearly 2,000 real driver shots. Explore how moving impact around the clubface changes carry distance—and notice where the model admits it doesn't have enough data to make a confident prediction.
Clubface Strike Simulator
Pick a club speed, then click or drag on the face to place your strike. The network answers in real yards, using a fixed stock delivery (a +2° angle of attack with a square face and path). Where real shots thin out, a warning appears: the model is extrapolating there and its confidence means nothing. Toggle the map to paint its full read of the face.
Click or drag to place the impact location.
Same architecture and training recipe as the results-section network (401 knobs), retrained on all 1,997 strike-recorded shots; the page averages the same eight runs as the surface above. The pinned delivery is cleaner than most real swings in the data, and the slider covers 95 to 112 mph because outside that range almost nobody in the dataset produces this stock swing and the model would be guessing. One more honesty note: against the closest matching real shots, the absolute yardage runs 10 to 25 yards optimistic in the middle of the speed range, so trust the differences between strikes more than the raw number.
What the simulator showed
The simulator makes one thing clear: there is a sweet spot near the center of the clubface. But before trusting that result, I wanted to answer one final question...
Did it really learn the sweet spot?
Before believing the result, we need to know whether the network is fooling us. In this dataset, off-center strikes and crooked deliveries often happen together (strike offset and face angle correlate at r ≈ 0.4). The network might simply be using strike location as a stand-in for the rest of the swing. To test that, I designed one final experiment. I subtracted what a straight-line model predicts from the four delivery variables, then trained the smallest network in this post using only the two strike coordinates on the remaining yards...
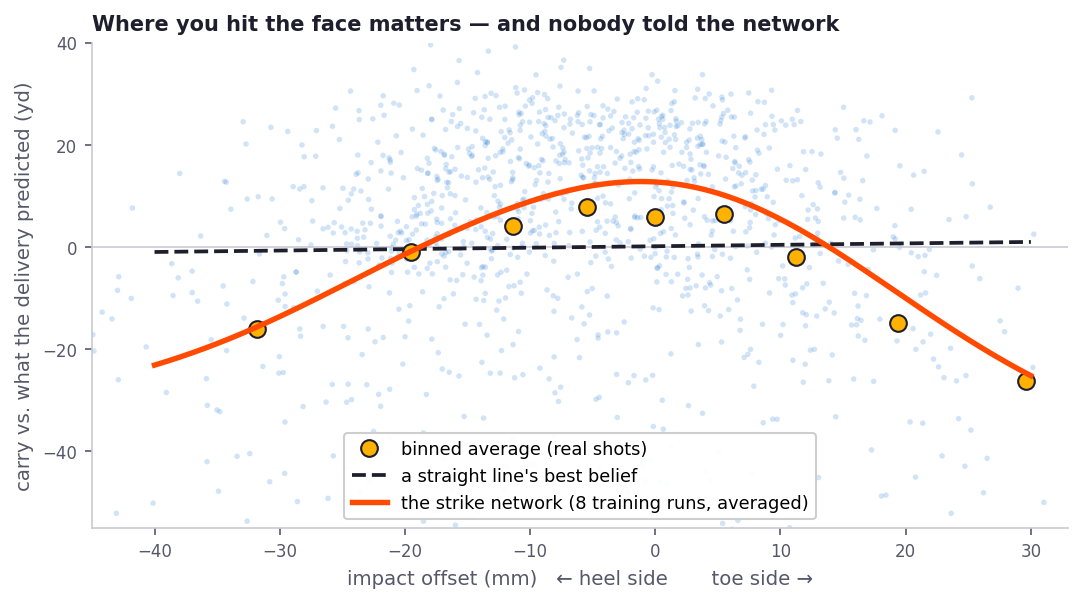
Every dot is a real driver shot: how much farther or shorter it flew than its delivery predicted, plotted against strike location. Gold dots are binned averages, the dashed line is the best straight-line fit, and the orange curve is the strike-only neural network.
Here’s what’s interesting… nobody told the network that heel strikes go nowhere. It saw 1,997 strangers' driver shots and rediscovered the sweet spot on its own. Even more interesting, it identified the worst misses high on the toe rather than the heel—something I didn't expect. Two checks suggest that pattern is real, not an illusion. Adding this learned strike map to the straight-line model reduced the average error on unseen shots from 19.2 to 17.3 yards, bringing it within about a yard of the full six-variable network. Even when I hand-fed the straight-line model squared strike terms, it still averaged 17.5 yards, because the true relationship isn't quite a parabola—and the neural network never had to assume a particular shape.
Going a little deeper
What a hidden layer really is. The 16 neurons of the first layer each compute one straight-line summary of the six delivery numbers. That means the layer converts every shot into 16 new numbers: a new coordinate system, learned from scratch, in which the last neuron's humble straight-line arithmetic is enough to predict golf well. Deep learning in one sentence: it is the simple model, plus the machine inventing the features the simple model needed.
The control experiment. On the full premium-ball set with no strike columns at all, the network still beats the line, 16.0 vs. 19.1 yards across 7,441 shots, so the delivery numbers alone carry curvature a flat model can't express. Those numbers come from a larger slice of the data than the strike subset, so compare them to each other, not to the numbers above.
The limits
It memorizes when data is scarce. Hand a 16-neuron network six shots and it will invent an absurd theory that nails all six and means nothing. The cure is more data, held-out grading, and suspicion, and it's why every number in this post is measured on unseen shots.
It can get stuck, and it can blow up. The shallow valley from the landscape figure is real. Two training runs from different random starting knobs can settle into different valleys, which is exactly why the clubface figures average eight runs, and why I report shapes confidently and exact yardages loosely.
It interpolates. It does not understand. Ask my golf network about a 130-mph swing striking 30 mm toward the toe, a shot that exists nowhere in its training data, and it will answer fluently and mean nothing by it. Networks never say "I don't know" on their own; the simulator's warning label is something I added from the outside. Every modern AI failure mode I read about now, I picture as an empty corner of the data being shaded with total confidence.
It learned the sweet spot, not my sweet spot. These are many golfers' swings (the middle 90% of club speeds runs 76 to 113 mph, a wider spread than any one player produces). That breadth is good for training, and it means the model knows drivers in general, not me. It has never seen a single one of my swings.
This is the toy end of the field. Real systems swap in cheaper bends, cleverer step sizes, and architectures shaped for images and language, and they train on more examples than every golf shot ever measured. None of that changes what the thing fundamentally is.
What I actually learned
I went in expecting to find wizardry at the center, and the center is smaller than that: multiply, add, squash, stack, roll downhill. I can hold the entire thing in my head now, which I could not say six months ago, when the phrase was doing my thinking for me.
The result that stays with me isn't the headline number. It's that the flashiest thing the network did, rediscovering the sweet spot, was worth about one yard of its edge, and the boring thing, bending the everyday speed-and-angle relationships, was worth almost four. I only know that because I checked, and my first draft of this post had it backwards. Models reward suspicion the way data does.
And the phrase itself lost its power over me, which I think is freeing. When a headline says a model "learned" something, I now picture a ball rolling down a 401-dimensional hill, and I ask more specific questions: learned from what data? Graded on what it hasn't seen? Confident where it's blind? That is the real souvenir from building one by hand.
